Tuesday, 28 July 2020

Web Tutorial: D3 Pie Chart (Part 4/4)

The first thing we'll do here is remove the red lines and the background colors.

div {outline: 0px solid #FF0000;}


.pieChartSvg
{
    width: 50%;
    height: 100%;
    float: left;
    background-color: rgba(200, 100, 100, 0);
}

.pieChartSvg text
{
    fill: rgba(255, 255, 0, 1);
    text-anchor: middle;
    font-weight: bold;
}

.pieLegendSvg
{
    width: 40%;
    height: 100%;
    float: right;
    background-color: rgba(100, 200, 100, 0);
}


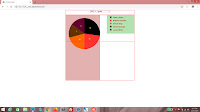
Yep, nice and clean now.


Let's add a nice deep red outline to the legend.
.pieLegendSvg
{
    width: 40%;
    height: 100%;
    float: right;
    background-color: rgba(100, 200, 100, 0);
    outline: 1px solid rgba(200, 0, 0, 1);
}


W0oT!


And then let's animate this guy...

First, before creating arc, let's create zeroArc. It's basically doing the same thing with the d3 object's arc() method, but with a much smaller outer radius.
var data = pie(dataSet.stats);

var zeroArc =
d3.arc()
.innerRadius(0)
.outerRadius(this.dataWidth);

var arc =
d3.arc()
.innerRadius(0)
.outerRadius((this.dataWidth / 2) * config.scale);


Now add a transition() method and a duration() method (with an interval of your choosing). The d attribute will still be set by arc after the transition.
chart
.selectAll("path")
.data(data)
.enter()
.append("path")
.attr("d", arc)
.attr("fill", function(d) {
    return d.data.color;
})
.transition()
.duration(500)
.attr("d", arc);


But before the transition, it will be set by zeroArc!
chart
.selectAll("path")
.data(data)
.enter()
.append("path")
.attr("d", zeroArc)
.attr("fill", function(d) {
    return d.data.color;
})
.transition()
.duration(500)
.attr("d", arc);


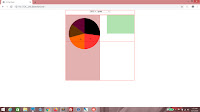
Now you see, when I change the year to 2018, the pie grows from small to large! Incidentally, the pie now shows that Sadio Mané scored the bulk of Liverpool's goals in 2018. What a dude.


Things get even more interesting when you go for a donut chart...
var arc =
d3.arc()
.innerRadius(this.dataWidth * 2)
.outerRadius((this.dataWidth / 2) * config.scale);


Slow the transition so you can see clearer.
chart
.selectAll("path")
.data(data)
.enter()
.append("path")
.attr("d", zeroArc)
.attr("fill", function(d) {
    return d.data.color;
})
.transition()
.duration(5000)
.attr("d", arc);


Beautiful!


Check out the live sample!


This web tutorial sure didn't take long. D3 simplifies a lot of stuff, but I guess developers only really truly appreciate that when they've had to go through the hassle of setting it up manually by HTML, CSS and vanilla JavaScript.

Pie for now!
T___T

Saturday, 25 July 2020

Web Tutorial: D3 Pie Chart (Part 3/4)

I'd like to interrupt this web tutorial to note that Liverpool lifted the EPL trophy a day ago, completing their season in style!

Back to the web tutorial...

Now we are going to build the legend. The purpose of this legend is to enable the user to see which colors represent which players. So for each entry in the legend, we have a colored rectangle and the player's name.

We begin by appending rect tags to legend the D3 way. We will use the labels array of the dataSet object as data.
chart
.selectAll("text")
.data(data)
.enter()
.append("text")
.attr("x", function(d)
{
    var midpoint = d.startAngle + ((d.endAngle - d.startAngle) / 2);
    return d3.pointRadial(midpoint, config.dataWidth * 3)[0];
})
.attr("y", function(d)
{
    var midpoint = d.startAngle + ((d.endAngle - d.startAngle) / 2);
    return d3.pointRadial(midpoint, config.dataWidth * 3)[1];
})
.text(function(d)
{
    return d.value;
});

legend
.selectAll("rect")
.data(dataSet.labels)
.enter()
.append("rect");


Each of them will use the color specified by d.
legend
.selectAll("rect")
.data(dataSet.labels)
.enter()
.append("rect")
.attr("fill", function(d)
{
    return d.color;
});


For the x value, we'll just use the dataSpacing property so each rectangle should have a little space from the leftmost edge. For y, we'll need to use the index, i. Multiple this by dataSpacing to get the y attribute of the current rectangle (plus another dataSpacing gap at the top) because all the rectangles will form a single vertical column.
legend
.selectAll("rect")
.data(dataSet.labels)
.enter()
.append("rect")
.attr("x", function(d)
{
    return config.dataSpacing + "em";
})
.attr("y", function(d, i)
{
    return ((config.dataSpacing * i) + config.dataSpacing)  + "em";
})
.attr("fill", function(d)
{
    return d.color;
});


Then set the width and height of each rect tag to half the dataSpacing property.
legend
.selectAll("rect")
.data(dataSet.labels)
.enter()
.append("rect")
.attr("x", function(d)
{
    return config.dataSpacing + "em";
})
.attr("y", function(d, i)
{
    return ((config.dataSpacing * i) + 1)  + "em";
})
.attr("fill", function(d)
{
    return d.color;
})
.attr("width", function(d)
{
    return (config.dataSpacing / 2) + "em";
})
.attr("height", function(d)
{
    return (config.dataSpacing / 2) + "em";
});


There now!


The next step will be placing text. Append text tags to legend the D3 way, again using the labels array as data.
legend
.selectAll("rect")
.data(dataSet.labels)
.enter()
.append("rect")
.attr("x", function(d)
{
    return config.dataSpacing + "em";
})
.attr("y", function(d, i)
{
    return ((config.dataSpacing * i) + 1)  + "em";
})
.attr("fill", function(d)
{
    return d.color;
})
.attr("width", function(d)
{
    return (config.dataSpacing / 2) + "em";
})
.attr("height", function(d)
{
    return (config.dataSpacing / 2) + "em";
});

legend
.selectAll("text")
.data(dataSet.labels)
.enter()
.append("text");


The text will be the title property of d.
legend
.selectAll("text")
.data(dataSet.labels)
.enter()
.append("text")
.text(function(d)
{
    return d.title;
});


For y values, follow what we did for the rectangles. For x values, double the dataSpacing property because we need to avoid overlapping the colored rectangles.
legend
.selectAll("text")
.data(dataSet.labels)
.enter()
.append("text")
.attr("x", function(d)
{
    return (config.dataSpacing * 2) + "em";
})
.attr("y", function(d, i)
{
    return ((config.dataSpacing * i) + config.dataSpacing)  + "em";
})
.text(function(d)
{
    return d.title;
});


Nice, right?


Now style the text. I'm just gonna make them bold and give them a deep red color.
.pieLegendSvg
{
    width: 40%;
    height: 100%;
    float: right;
    background-color: rgba(100, 200, 100, 0.5);
}

.pieLegendSvg text
{
    fill: rgba(200, 0, 0, 1);
    text-anchor: left;
    font-weight: bold;
}


Great!


We have a functioning pie chart. Change the values in the drop-down lists to see the values change...

Next

Time to jazz things up a bit.

Wednesday, 22 July 2020

Web Tutorial: D3 Pie Chart (Part 2/4)

So now we have a placeholder to put the pie chart in, and let's waste no time getting into it.

Add properties scale, dataWidth and dataSpacing to the config object. Also add the setData() method.

scale is used to enlarge or shrink your chart as you see fit. It beats having to make changes to the whole of your setup when you can just change one value.

dataWidth specifies the diameter of your pie and width of your legend.

dataSpacing is all the spaces between your elements and data points.

And, of course, setData() renders your pie chart.
var config =
{
    "scale": 12,
    "dataWidth": 20,
    "dataSpacing": 2,
    "setData": function ()
    {

    }
}


In here, get the values of the drop-down lists, assigning the value to the variables year and stat. Those will be used to generate the pie.
"setData": function ()
{
    var year = d3.select("#ddlYear").node().value;
    var stat = d3.select("#ddlStat").node().value;
}


Then create the dataSet object with the arrays labels and stats.
"setData": function ()
{
    var year = d3.select("#ddlYear").node().value;
    var stat = d3.select("#ddlStat").node().value;

    var dataSet =
    {
      "labels": [],
      "stats": []
    };
}


Use a For loop to go through the cols array of the graphData object.
var dataSet =
{
  "labels": [],
  "stats": []
};

for (var i = 0; i < graphData.cols.length; i++)
{

}


Declare the array filtered and use the filter() method on the stats array of each element, returning those that correspond with year. If filtered is not empty...
for (var i = 0; i < graphData.cols.length; i++)
{
    var filtered = graphData.cols[i].stats.filter(function(x) { return x.year == year;})

    if (filtered.length > 0)
    {

    }
}


... and if the value of the required stat is not 0, push in data such as color and values into the appropriate arrays. Why do we have this condition? Well, it's a pie, and zero values aren't supposed to show up, that's why.
for (var i = 0; i < graphData.cols.length; i++)
{
    var filtered = graphData.cols[i].stats.filter(function(x) { return x.year == year;})

    if (filtered.length > 0)
    {
        if (filtered[0][stat] > 0)
        {
            dataSet.labels.push({title: graphData.cols[i].title, color: graphData.cols[i].color});
            dataSet.stats.push({value: filtered[0][stat], color: graphData.cols[i].color});        
        }
    }
}


Now, use the d3 object's select() method to grab the container, wrapper, chart and legend.
for (var i = 0; i < graphData.cols.length; i++)
{
    var filtered = graphData.cols[i].stats.filter(function(x) { return x.year == year;})

    if (filtered.length > 0)
    {
        if (filtered[0][stat] > 0)
        {
            dataSet.labels.push({title: graphData.cols[i].title, color: graphData.cols[i].color});
            dataSet.stats.push({value: filtered[0][stat], color: graphData.cols[i].color});        
        }
    }
}

var container = d3.select(".pieChartContainer");
var wrapper = d3.select(".pieChart");
var chart = d3.select(".pieChartSvg");
var legend = d3.select(".pieLegendSvg");


This next piece of code sets the width of the container. Since the dataWidth property of the config object is supposed to define the diameter of the pie and the width of the legend, and we want to have some spacing on both sides of the chart, the width of the chart should be double the sum of dataSpacing and dataWidth.
var container = d3.select(".pieChartContainer");
var wrapper = d3.select(".pieChart");
var chart = d3.select(".pieChartSvg");
var legend = d3.select(".pieLegendSvg");

container
.style("width", function(d)
{
    return ((config.dataSpacing + config.dataWidth) * 2) + "em";
});


wrapper measures the height of the chart, which is the diameter of the pie plus spacing at the bottom and top. The height of the legend is measured by how many players are being represented in the pie (which is the length property of the labels array of the dataSet object), plus a bit of spacing at the top. Whichever is greater is the returned value for wrapper.
container
.style("width", function(d)
{
    return ((config.dataSpacing + config.dataWidth) * 2) + "em";
});

wrapper
.style("height", function(d)
{
    var legendHeight = (config.dataSpacing * dataSet.labels.length) + 2;
    var chartHeight = config.dataSpacing + (config.dataWidth * 2);

    return (chartHeight > legendHeight ? chartHeight : legendHeight) + "em";
});


Now this next bit may not make sense at first. so bear with me. In chart, append a g tag. g is a group, in which we will append pie slices. And since they will all originate from here, g will be a one pixel element located right in the middle of chart. And that's why we use the transform property to translate the g tag. The x and y values for the translation are the same - the sum of half of dataSpacing (resulting in the radius of the pie) and dataWidth, multiplied by the scale property.

While we're at it, let's also clear the legend and set its height.
wrapper
.style("height", function(d)
{
    var legendHeight = (config.dataSpacing * dataSet.labels.length) + 2;
    var chartHeight = config.dataSpacing + (config.dataWidth * 2);

    return (chartHeight > legendHeight ? chartHeight : legendHeight) + "em";
});

chart
.html("")
.append("g")
.attr("transform", "translate(" + ((config.dataSpacing + (config.dataWidth / 2)) * (config.scale)) + "," + ((config.dataSpacing + (config.dataWidth / 2)) * (config.scale)) + ")");

legend
.html("")
.style("height", function(d) {
    return ((config.dataSpacing * dataSet.labels.length) + 2) + "em";
});


And then we set chart to the freshly created g tag instead. What this means is that every element inserted into this group will automatically be translated.
chart
.html("")
.append("g")
.attr("transform", "translate(" + ((config.dataSpacing + (config.dataWidth / 2)) * (config.scale)) + "," + ((config.dataSpacing + (config.dataWidth / 2)) * (config.scale)) + ")");

chart = d3.select(".pieChartSvg g");

legend
.html("")
.style("height", function(d) {
    return ((config.dataSpacing * dataSet.labels.length) + 2) + "em";
});


Now we run the pie() method of the d3 object! This should work in Version 3 but somehow doesn't, so I'm not gonna sweat it and just use Version 4 instead. At the time of this writing, Version 5 of D3 is out already and as such I see no value in persisting with Version 3.

What does pie() do? This method creates a function which will be used to calculate the angle values for any array of values you pass in later. Do let's set the function to a variable called pie.
legend
.html("")
.style("height", function(d) {
    return ((config.dataSpacing * dataSet.labels.length) + 2) + "em";
});

var pie =
d3.pie()
.value(function(d)
{
    return d.value;
});


Declare data, and use our newly minted pie() function, passing in the stats array of the dataSet object as an argument. This will convert data into an array of all the start and end angles of each pie slice, based on the stats array!
var pie =
d3.pie()
.value(function(d)
{
    return d.value;
});

var data = pie(dataSet.stats);


Now we declare the variable arc. Set arc to the function returnd by the arc() method of the d3 object. In here. we are going to declare two things by running the innerRadius() and outerRadius() methods. We want a pie, so the inner radius needs to be 0. If we wanted a donut, of course, then we'd have a larger number.

For the outer radius, we use the dataWidth property, halved, which is the intended radius of the pie, multipled by scale.
var data = pie(dataSet.stats);

var arc =
d3.arc()
.innerRadius(0)
.outerRadius((this.dataWidth / 2) * config.scale);


Are you ready? Because the next part is pure D3 magic. We grab chart (which is now the grouping element in the SVG) and append a path tag to it. For data, we'll pass in data which is actually the array of start and end angles generated by the pie() function! Isn't it nice you didn't have to calculate it yourself?
var arc =
d3.arc()
.innerRadius(0)
.outerRadius((this.dataWidth / 2) * config.scale);

chart
.selectAll("path")
.data(data)
.enter()
.append("path");


Obviously, once you append a path tag, you will need its d attribute. d is supplied by arc itself! Now, how did that happen? The thing is, the newly generated arc() function uses the inner and outer radii specified, plus the start and end angle given by data, and generates the d attribute of the pie slice from there.
chart
.selectAll("path")
.data(data)
.enter()
.append("path")
.attr("d", arc);


Next, supply the fill attribute by referencing the color property of the data object inside d.
chart
.selectAll("path")
.data(data)
.enter()
.append("path")
.attr("d", arc)
.attr("fill", function(d) {
    return d.data.color;
});


How did we get that data object inside d anyway?

Remember this? This basically ensured that when we ran the pie() function, it would embed the current value of d (which was the object containing the value and color) into data, along with the generated start and end angles!
var pie =
d3.pie()
.value(function(d)
{
    return d.value;
});

var data = pie(dataSet.stats);


Now near the bottom of your code, don't forget to call the setData() method after populating the drop-down lists... and also set the method to run every time the values of the drop-down lists change.
ddlStat.selectAll("option")
.data(graphData.stats)
.enter()
.append("option")
.property("selected", function(d, i)
{
    return i == 0;
})
.attr("value", function(d)
{
    return d;
})
.text(function(d)
{
    return d;
});

config.setData();

d3.select("#ddlYear").on("change", function() { config.setData(); });
d3.select("#ddlStat").on("change", function() { config.setData(); });


Anyway. This is your pie! You should see how it fits in with the area you've defined.


We're not quite done yet...

Remember we still have values to use? Let's use 'em!

Using the D3 method, insert text tags into chart. Remember chart is, at this point, referring to the grouping tag within the SVG. For data(), you pass in data again. The text() method is straightforward, and here you're just supplying the value property.
chart
.selectAll("path")
.data(data)
.enter()
.append("path")
.attr("d", arc)
.attr("fill", function(d) {
    return d.data.color;
});

chart
.selectAll("text")
.data(data)
.enter()
.append("text")
.text(function(d)
{
    return d.value;
});


For the x and y positioning of the text, we need to run the pointRadial() method of the d3 object. What does this do? Well, it takes an angle and a distance as parameters, and returns an array with x and y coordinates. Read more about it here!

To find the appropriate angle, we'll use the startAngle and endAngle properties of d (which were generated earlier using pie(), remember?) and determine the midpoint with some arithmetic. pointRadial() doesn't count the distance in em, so we'll need to pad dataWidth a bit.

Then after running the pointRadial() method, get the first element in the array returned as the x attribute.
chart
.selectAll("text")
.data(data)
.enter()
.append("text")
.attr("x", function(d)
{
    var midpoint = d.startAngle + ((d.endAngle - d.startAngle) / 2);
    return d3.pointRadial(midpoint, config.dataWidth * 3)[0];
})
.text(function(d)
{
    return d.value;
});


For y, do the same but get the second element.
chart
.selectAll("text")
.data(data)
.enter()
.append("text")
.attr("x", function(d)
{
    var midpoint = d.startAngle + ((d.endAngle - d.startAngle) / 2);
    return d3.pointRadial(midpoint, config.dataWidth * 3)[0];
})
.attr("y", function(d)
{
    var midpoint = d.startAngle + ((d.endAngle - d.startAngle) / 2);
    return d3.pointRadial(midpoint, config.dataWidth * 3)[1];
})
.text(function(d)
{
    return d.value;
});


We have numbers nicely positioned! But they need to be styled.


So let's set the color to a nice yellow. Add any other formatting you'd like.
.pieChartSvg
{
    width: 50%;
    height: 100%;
    float: left;
    background-color: rgba(200, 100, 100, 0.5);
}

.pieChartSvg text
{
    fill: rgba(255, 255, 0, 1);
    text-anchor: middle;
    font-weight: bold;
}

.pieLegendSvg
{
    width: 40%;
    height: 100%;
    float: right;
    background-color: rgba(100, 200, 100, 0.5);
}


Nice!


Next

A pie's not complete without a legend. We'll be working on that next. Don't go away!

Monday, 20 July 2020

Web Tutorial: D3 Pie Chart (Part 1/4)

After showing you how to make a bar and line chart in D3, the natural progression from such hallowed acts of achievement would be the pie chart. Sure, back in 2017, I walked you through creating a pie chart using only HTML, CSS and vanilla JavaScript. It was a lot of fun, but the math was just... ugh. There are far easier ways; namely various charting libraries.

And, of course, D3 is one such charting library.

The past two web tutorials used version 3 of D3, but for this one we will use version 4 because that's the version which actually has the functions we need to produce that pie. And unlike in the case of the line chart web tutorial a couple months back, we won't be reusing all much code because the operation is very different.

So let's get to it!

We begin with some boilerplate HTML. Once again, note that the D3 library we're using is version 4. Font size and type has been set.
<!DOCTYPE html>
<html>
    <head>
        <title>D3 Pie Chart</title>

        <style>
            body
            {
                font-size: 12px;
                font-family: arial;
            }
        </style>

        <script src="https://d3js.org/d3.v4.min.js"></script>
    </head>

    <body>
        <script>

        </script>
    </body>
</html>


In the body, insert a div with an class of pieChartContainer. That will contain all the elements of the entire setup. Then insert a div into that, and give it a class of pieDashboard.
<body>
    <div class="pieChartContainer">
        <div class="pieDashboard">

        </div>
    </div>
   
    <script>

    </script>
</body>


In that div, you'll want two drop-down lists. They're ddlYear and ddlStat.
<body>
    <div class="pieChartContainer">
        <div class="pieDashboard">
            <select id="ddlYear">

            </select>

            <select id="ddlStat">

            </select>
        </div>
    </div>
   
    <script>

    </script>
</body>


After this, insert another div into the div styled using pieChartContainer. This one has the pieChart class. It will hold the chart.
<body>
    <div class="pieChartContainer">
        <div class="pieDashboard">
            <select id="ddlYear">

            </select>

            <select id="ddlStat">

            </select>
        </div>

        <div class="pieChart">

        </div>
    </div>
   
    <script>

    </script>
</body>


Within this div, insert two svg tags. The first has a class of pieChartSvg, and the second pieLegendSvg. No prizes for guessing what they'll be doing, eh?
<body>
    <div class="pieChartContainer">
        <div class="pieDashboard">
            <select id="ddlYear">

            </select>

            <select id="ddlStat">

            </select>
        </div>

        <div class="pieChart">
            <svg class="pieChartSvg">

            </svg>

            <svg class="pieLegendSvg">

            </svg>
        </div>
    </div>
   
    <script>

    </script>
</body>


Let's do some styling. First, ensure that all divs have a red outline so you can see what you're doing.
<style>
    body
    {
        font-size: 12px;
        font-family: arial;
    }   

    div {outline: 1px solid #FF0000;}
</style>


Then add the class for pieChartContainer. We're going to specify width and height here using em, and set it middle of the page.
<style>
    body
    {
        font-size: 12px;
        font-family: arial;
    }   

    div {outline: 1px solid #FF0000;}
   
    .pieChartContainer
    {
        width: 100em;
        height: 20em;
        margin: 0 auto 0 auto;
    }
</style>


Next is pieDashboard. It has a small height and all of its parent's width. The text-align property will push the drop-down lists to the middle, since they're inline elements.
div {outline: 1px solid #FF0000;}

.pieDashboard
{
    height: 3em;
    width: 100%;
    text-align: center;
}

.pieChartContainer
{
    width: 100em;
    height: 20em;
    margin: 0 auto 0 auto;
}


And finally, pieChart. width and height are 100%.
div {outline: 1px solid #FF0000;}

.pieDashboard
{
    height: 3em;
    width: 100%;
    text-align: center;
}

.pieChart
{
    width: 100%;
    height: 100%;
}

.pieChartContainer
{
    width: 100em;
    height: 20em;
    margin: 0 auto 0 auto;
}


This is what you should see. You'll notice the div styled using pieChart has been pushed down because the dashboard occupies 3em height. No worries.


Now float pieChartSvg left, and pieLegendSvg right. Specify their widths using percentages (ensure that the combined total width doesn't exceed 100), and give both heights of 100%. Give them a random background color so we can see what's going on.
.pieChartContainer
{
    width: 100em;
    height: 20em;
    margin: 0 auto 0 auto;
}

.pieChartSvg
{
    width: 50%;
    height: 100%;
    float: left;
    background-color: rgba(200, 100, 100, 0.5);
}

.pieLegendSvg
{
    width: 40%;
    height: 100%;
    float: right;
    background-color: rgba(100, 200, 100, 0.5);
}


Here you'll see the shape of things.


Now for some data! We'll just reuse the graphData object from earlier web tutorials.
<script>
var graphData =
{
    "cols":
    [
        {
            "title": "Adam Lallana",
            "stats":
            [
                {"year": 2015, "goals": 7, "appearances": 49},
                {"year": 2016, "goals": 8, "appearances": 35},
                {"year": 2017, "goals": 0, "appearances": 15},
                {"year": 2018, "goals": 0, "appearances": 16}
            ]
        },
        {
            "title": "Sadio ManĂ©",
            "stats":
            [
                {"year": 2016, "goals": 13, "appearances": 29},
                {"year": 2017, "goals": 20, "appearances": 44},
                {"year": 2018, "goals": 26, "appearances": 50}
            ]
        },
        {
            "title": "Roberto Firminho",
            "stats":
            [
                {"year": 2015, "goals": 11, "appearances": 49},
                {"year": 2016, "goals": 12, "appearances": 41},
                {"year": 2017, "goals": 27, "appearances": 54},
                {"year": 2018, "goals": 16, "appearances": 48}
            ]
        },
        {
            "title": "Divock Origi",
            "stats":
            [
                {"year": 2015, "goals": 10, "appearances": 33},
                {"year": 2016, "goals": 11, "appearances": 43},
                {"year": 2017, "goals": 0, "appearances": 1},
                {"year": 2018, "goals": 7, "appearances": 21}
            ]
        },
        {
            "title": "Daniel Sturridge",
            "stats":
            [
                {"year": 2015, "goals": 13, "appearances": 25},
                {"year": 2016, "goals": 7, "appearances": 27},
                {"year": 2017, "goals": 3, "appearances": 14},
                {"year": 2018, "goals": 4, "appearances": 27}
            ]
        },
        {
            "title": "James Milner",
            "stats":
            [
                {"year": 2015, "goals": 7, "appearances": 45},
                {"year": 2016, "goals": 7, "appearances": 40},
                {"year": 2017, "goals": 1, "appearances": 47},
                {"year": 2018, "goals": 7, "appearances": 45}
            ]
        },
    ],
    "rows": [2015, 2016, 2017, 2018],
    "stats": ["goals", "appearances"]
};
</script>


For every element in the cols array, let's add a property, color. Assign each player a different color.
<script>
var graphData =
{
    "cols":
    [
        {
            "title": "Adam Lallana",
            "color": "rgb(100, 50, 0)",
            "stats":
            [
                {"year": 2015, "goals": 7, "appearances": 49},
                {"year": 2016, "goals": 8, "appearances": 35},
                {"year": 2017, "goals": 0, "appearances": 15},
                {"year": 2018, "goals": 0, "appearances": 16}
            ]
        },
        {
            "title": "Sadio ManĂ©",
            "color": "rgb(255, 0, 0)",
            "stats":
            [
                {"year": 2016, "goals": 13, "appearances": 29},
                {"year": 2017, "goals": 20, "appearances": 44},
                {"year": 2018, "goals": 26, "appearances": 50}
            ]
        },
        {
            "title": "Roberto Firminho",
            "color": "rgb(255, 50, 50)",
            "stats":
            [
                {"year": 2015, "goals": 11, "appearances": 49},
                {"year": 2016, "goals": 12, "appearances": 41},
                {"year": 2017, "goals": 27, "appearances": 54},
                {"year": 2018, "goals": 16, "appearances": 48}
            ]
        },
        {
            "title": "Divock Origi",
            "color": "rgb(255, 100, 0)",
            "stats":
            [
                {"year": 2015, "goals": 10, "appearances": 33},
                {"year": 2016, "goals": 11, "appearances": 43},
                {"year": 2017, "goals": 0, "appearances": 1},
                {"year": 2018, "goals": 7, "appearances": 21}
            ]
        },
        {
            "title": "Daniel Sturridge",
            "color": "rgb(0, 0, 0)",
            "stats":
            [
                {"year": 2015, "goals": 13, "appearances": 25},
                {"year": 2016, "goals": 7, "appearances": 27},
                {"year": 2017, "goals": 3, "appearances": 14},
                {"year": 2018, "goals": 4, "appearances": 27}
            ]
        },
        {
            "title": "James Milner",
            "color": "rgb(100, 0, 50)",
            "stats":
            [
                {"year": 2015, "goals": 7, "appearances": 45},
                {"year": 2016, "goals": 7, "appearances": 40},
                {"year": 2017, "goals": 1, "appearances": 47},
                {"year": 2018, "goals": 7, "appearances": 45}
            ]
        },
    ],
    "rows": [2015, 2016, 2017, 2018],
    "stats": ["goals", "appearances"]
};
</script>


While you're at it, add the config object. We won't use it just yet.
var graphData =
{
    "cols":
    [
        {
            "title": "Adam Lallana",
            "color": "rgb(100, 50, 0)",
            "stats":
            [
                {"year": 2015, "goals": 7, "appearances": 49},
                {"year": 2016, "goals": 8, "appearances": 35},
                {"year": 2017, "goals": 0, "appearances": 15},
                {"year": 2018, "goals": 0, "appearances": 16}
            ]
        },
        {
            "title": "Sadio ManĂ©",
            "color": "rgb(255, 0, 0)",
            "stats":
            [
                {"year": 2016, "goals": 13, "appearances": 29},
                {"year": 2017, "goals": 20, "appearances": 44},
                {"year": 2018, "goals": 26, "appearances": 50}
            ]
        },
        {
            "title": "Roberto Firminho",
            "color": "rgb(255, 50, 50)",
            "stats":
            [
                {"year": 2015, "goals": 11, "appearances": 49},
                {"year": 2016, "goals": 12, "appearances": 41},
                {"year": 2017, "goals": 27, "appearances": 54},
                {"year": 2018, "goals": 16, "appearances": 48}
            ]
        },
        {
            "title": "Divock Origi",
            "color": "rgb(255, 100, 0)",
            "stats":
            [
                {"year": 2015, "goals": 10, "appearances": 33},
                {"year": 2016, "goals": 11, "appearances": 43},
                {"year": 2017, "goals": 0, "appearances": 1},
                {"year": 2018, "goals": 7, "appearances": 21}
            ]
        },
        {
            "title": "Daniel Sturridge",
            "color": "rgb(0, 0, 0)",
            "stats":
            [
                {"year": 2015, "goals": 13, "appearances": 25},
                {"year": 2016, "goals": 7, "appearances": 27},
                {"year": 2017, "goals": 3, "appearances": 14},
                {"year": 2018, "goals": 4, "appearances": 27}
            ]
        },
        {
            "title": "James Milner",
            "color": "rgb(100, 0, 50)",
            "stats":
            [
                {"year": 2015, "goals": 7, "appearances": 45},
                {"year": 2016, "goals": 7, "appearances": 40},
                {"year": 2017, "goals": 1, "appearances": 47},
                {"year": 2018, "goals": 7, "appearances": 45}
            ]
        },
    ],
    "rows": [2015, 2016, 2017, 2018],
    "stats": ["goals", "appearances"]
};

var config =
{
   
}


The next thing we will do, is populate the drop-down lists. If you've gone through any of the other web tutorials, I've probably repeated the instructions ad nauseam. It's basically the same as what we did for the bar chart.
var config =
{
   
}

var ddlYear = d3.select("#ddlYear");

ddlYear.selectAll("option")
.data(graphData.rows)
.enter()
.append("option")
.property("selected", function(d, i)
{
    return i == 0;
})
.attr("value", function(d)
{
    return d;
})
.text(function(d)
{
    return d;
});

var ddlStat = d3.select("#ddlStat");

ddlStat.selectAll("option")
.data(graphData.stats)
.enter()
.append("option")
.property("selected", function(d, i)
{
    return i == 0;
})
.attr("value", function(d)
{
    return d;
})
.text(function(d)
{
    return d;
});


So there you go - your drop-down lists!


Next

Things will get a bit complicated. We will dive right into creating your pie chart.

Thursday, 16 July 2020

The Day The Penny Dropped

One of the tasks that got thrown to me in the past few years, by virtue of my not being particularly fussy about what kind of tasks I was assigned, was automated DevOps.

I'm not afraid to say I struggled at the task. Shitty Team Foundation Server (TFS) interface aside, I really wasn't getting the entire build/artifact/configuration/working directory relationship. My Team Lead at the time was dismayed at my apparent inability to understand the process, but since nobody else in my team was willing to shoulder the burden, it fell to me. Note that I wasn't particularly enthusiastic about the task. I just wasn't picky.

So I kept at it, trying to commit everything to memory. But the thing about learning something is, often, simply memorizing it isn't the key. The key is understanding, and the pieces just weren't falling into place.

The final piece.

My Team Lead kept yammering on about artifacts and builds, but this wasn't helping much.

Until one day, I was thinking about Gary Mitchell's Ten Principles of Adult Learning. In particular, the fourth one - People learn easiest what is familiar to them.

That was when the lightbulb flickered. I was going about it all wrong.

What I was doing, was approaching automated DevOps like it was a completely new thing. What was the end result of deployment? A working ASP.NET MVC site. Hadn't I dealt with ASP.NET MVC back in 2012? I had deployed back then, as well, except it had been the manual way. Now what I was trying to do was automate this process.

That train of thought led me further along the path. What had I done back then? The views and assets had been copied directly to the server. I'd had to build, and then copied the resultant DLL file. What were the steps of the automated DevOps, but configured instructions in TFS to do pretty much the same thing?

From there, my understanding of the process grew at an astronomical rate, and within a week, the inevitable happened - a successful series of tests.

About my Team Lead

Not saying he couldn't have done better. Obviously, he could have. But while he was a better tech than I am, unlike me, he wasn't trained to transfer knowledge. He didn't have an ACTA.

On my part, when I set out on my quest for that ACTA in 2017, I had envisioned using it to better transfer knowledge. I certainly hadn't anticipated using the principles learned in order to teach myself.

Life throws you surprises every now and then. This was a pleasant one.

Yours (l)earnestly,
T___T

Wednesday, 8 July 2020

The Electoral Choice, explained in JavaScript

While I don't use Facebook nearly as much as I used to, I like to keep certain types of people on my Friends list.

There are the pro-Government types, in particular, the ever-enthusiastic fans of the incumbent, the People's Action Party (PAP). They post glowing gushing paragraphs about the PAP, extolling their virtues and taking their side in just about every matter, and they crap on the other political parties every opportunity they get.

And then there are the anti-establishment types. They'll oppose the People's Action Party on principle, and always have something negative to say in response. And they will support any political party that isn't the People's Action Party. Well, almost any; some political parties are such no-hopers that anyone in their right mind would be hard-pressed to support them.

And every five years, during the Singapore General Elections, something beautiful happens. Everyone goes full retard. At the same time.

Going full retard.

The pro-Government types will fiercely defend the PAP and vilify the other political parties. The anti-establishment types will vilify the PAP and take the side of the other political parties. In other words, everyone picks a side and praises their own side for doing something, while shitting on the other side just as passionately for doing pretty much the same thing.

The pro-Government types will predictably only vote PAP come what may. And the anti-establishment types will vote just about any political party that isn't the PAP. This is generally why I think political rallies are useless. Everyone has pretty much already made up their minds whom they will vote for. Few people are going to change their vote over some pretty and persuasive words during a passionate rally, and I wouldn't expect them to.

Whom do I support? Let's just say people like me are on the fence and probably equally despised by everybody. People think I'm "neutral" just so I can say I'm smarter than the extremists in both camps. But honestly, that would be more of a bragging right if you guys in your political camps weren't so goddamn foolish.

People despise fence-sitters because they want us to pick a side (preferably theirs), take a stand. But I am taking a stand. My stand is that of the voter.

Let's explain this in programming terms!

Let's say your vote is represented by a JavaScript variable.
var vote;

During an election, various parties would be working hard to change your vote to this...
var vote;

vote = "PAP";

...or this!
var vote;

vote = "WP";

That's good, and perfectly normal. But unfortunately, what I see is this...
const voteForPAP = true;

...or this!
const voteForPAP = false;


In programming, constants can't be changed. They can only be taken reference from. Variable values can be changed, and arguably, much of programming involves changing the values of variables.

What's the difference between people who will always vote for the PAP, or those who will never vote for the PAP? No difference. You no longer matter. If your vote is unchangeable, congratulations, you've pretty much made your vote (and by extension, yourself) irrelevant. No one is interested in working for your vote because your vote can't be earned, or changed.

Working to earn a vote that will never be given is nothing but a massive waste of time. Working to earn a vote that will always be given is also a colossal time-waster. That's right, Junior, you ain't worth the effort. And you have no one but your obstinate self to blame for that.

Final thoughts

People whose votes are already fixed, aren't the goal. They're the goalposts!

Be the goal, not the goalpost.

In football, players don't aim for the goalpost. They aim for the goal. Even if they do aim for the goalpost, ultimately, the intention is for the ball to rebound off the goalpost into goal.

Don't be binary. The only person it hurts is yourself.

vote = "whomever";
T___T