D3 is a charting and data visualization library that's fairly easy to get off the ground with. Today, we're going to render the animated Bar Chart using this library. We'll use pretty much the same data structure we used back then for Liverpool FC... but with some updates for 2020!
Also, D3 works better with SVG. A bar chart could quite easily be rendered using D3 and CSS but honestly, I'd recommend SVG any day of the week, if only to prime yourself for more complicated charts down the road.
Here, we have a basic HTML block. Let's set the default font.
<!DOCTYPE html>
<html>
<head>
<title>D3 Bar Chart</title>
<style>
body
{
font-size: 12px;
font-family: arial;
}
</style>
</head>
<body>
</body>
</html>
<html>
<head>
<title>D3 Bar Chart</title>
<style>
body
{
font-size: 12px;
font-family: arial;
}
</style>
</head>
<body>
</body>
</html>
Add in a link to the D3 JavaScript library. Also, for D3, an accepted convention is to have the script tag within the body tag.
<!DOCTYPE html>
<html>
<head>
<title>D3 Bar Chart</title>
<style>
body
{
font-size: 12px;
font-family: arial;
}
</style>
<script src="https://d3js.org/d3.v3.min.js"></script>
</head>
<body>
<script>
</script>
</body>
</html>
<html>
<head>
<title>D3 Bar Chart</title>
<style>
body
{
font-size: 12px;
font-family: arial;
}
</style>
<script src="https://d3js.org/d3.v3.min.js"></script>
</head>
<body>
<script>
</script>
</body>
</html>
And then add a div with a class of barChartContainer, which will hold the entire thing.
<body>
<div class="barChartContainer">
</div>
<script>
</script>
</body>
<div class="barChartContainer">
</div>
<script>
</script>
</body>
In it, add two divs. One has an class of barDashboard, and the other, barChart.
<body>
<div class="barChartContainer">
<div class="barDashboard">
</div>
<div class="barChart">
</div>
</div>
<script>
</script>
</body>
<div class="barChartContainer">
<div class="barDashboard">
</div>
<div class="barChart">
</div>
</div>
<script>
</script>
</body>
In the first div, which is the dashboard, add two drop-down lists. Give them ids ddlYear and ddlStat. Don't give them any values yet!
<body>
<div class="barChartContainer">
<div class="barDashboard">
<select id="ddlYear">
</select>
<select id="ddlStat">
</select>
</div>
<div class="barChart">
</div>
</div>
<script>
</script>
</body>
<div class="barChartContainer">
<div class="barDashboard">
<select id="ddlYear">
</select>
<select id="ddlStat">
</select>
</div>
<div class="barChart">
</div>
</div>
<script>
</script>
</body>
Here's a preview of what you have...

Now, let's move on. The div that holds the bar chart will be made out of four SVGs. One is for the scale, and we will style it using the CSS class barScaleSvg.
<div class="barChart">
<svg class="barScaleSvg">
</svg>
</div>
<svg class="barScaleSvg">
</svg>
</div>
The next one is for the data, and the class is barChartSvg.
<div class="barChart">
<svg class="barScaleSvg">
</svg>
<svg class="barChartSvg">
</svg>
</div>
<svg class="barScaleSvg">
</svg>
<svg class="barChartSvg">
</svg>
</div>
Here we add a line break, making sure that it clears both sides of floats. You'll see why soon.
<div class="barChart">
<svg class="barScaleSvg">
</svg>
<svg class="barChartSvg">
</svg>
<br style="clear:both"/>
</div>
<svg class="barScaleSvg">
</svg>
<svg class="barChartSvg">
</svg>
<br style="clear:both"/>
</div>
Now we style the next SVG using CSS class barChartFiller. Because that's exactly what it is... filler. Nothing is going to go in there.
<div class="barChart">
<svg class="barScaleSvg">
</svg>
<svg class="barChartSvg">
</svg>
<br style="clear:both"/>
<svg class="barFillerSvg">
</svg>
</div>
<svg class="barScaleSvg">
</svg>
<svg class="barChartSvg">
</svg>
<br style="clear:both"/>
<svg class="barFillerSvg">
</svg>
</div>
Finally, the last SVG using the CSS class barChartLegend. It will contain the names of the players.
<div class="barChart">
<svg class="barScaleSvg">
</svg>
<svg class="barChartSvg">
</svg>
<br style="clear:both"/>
<svg class="barFillerSvg">
</svg>
<svg class="barLegendSvg">
</svg>
</div>
<svg class="barScaleSvg">
</svg>
<svg class="barChartSvg">
</svg>
<br style="clear:both"/>
<svg class="barFillerSvg">
</svg>
<svg class="barLegendSvg">
</svg>
</div>
Let's do some styling!
The styling, by itself, makes no real difference to the final product. It's just to give you an idea of what your content placeholder SVGs look like now.Let's style the barChartContainer CSS class to place everything middle of the screen...
body
{
font-size: 12px;
font-family: arial;
}
.barChartContainer
{
margin: 0 auto 0 auto;
}
{
font-size: 12px;
font-family: arial;
}
.barChartContainer
{
margin: 0 auto 0 auto;
}
barDashboard takes up 100% width and is 2em in height. Use the text-align property to place everything in the middle. Give it a black outline.
body
{
font-size: 12px;
font-family: arial;
}
.barDashboard
{
height: 2em;
width: 100%;
text-align: center;
}
.barChartContainer
{
margin: 0 auto 0 auto;
}
{
font-size: 12px;
font-family: arial;
}
.barDashboard
{
height: 2em;
width: 100%;
text-align: center;
}
.barChartContainer
{
margin: 0 auto 0 auto;
}
barChart also has a black outline. Nothing else needs to be set.
body
{
font-size: 12px;
font-family: arial;
}
.barDashboard
{
height: 2em;
width: 100%;
text-align: center;
}
.barChart
{
outline: 1px solid #000000;
}
.barChartContainer
{
margin: 0 auto 0 auto;
}
{
font-size: 12px;
font-family: arial;
}
.barDashboard
{
height: 2em;
width: 100%;
text-align: center;
}
.barChart
{
outline: 1px solid #000000;
}
.barChartContainer
{
margin: 0 auto 0 auto;
}
So far so good!

Now, let's style the placeholder SVGs. All of the SVGs will float left. For the scale and filler, we'll give a width of 5em to illustrate. The chart and legend will have a width of, say, 20em. As for heights, the scale and chart will be 20em tall, while the filler and legend will be 3em tall.
.barChartContainer
{
margin: 0 auto 0 auto;
}
.barScaleSvg
{
width: 5em;
height: 20em;
float: left;
}
.barChartSvg
{
width: 20em;
height: 20em;
float: left;
}
.barFillerSvg
{
width: 5em;
height: 3em;
float: left;
}
.barLegendSvg
{
width: 20em;
height: 3em;
float: left;
}
{
margin: 0 auto 0 auto;
}
.barScaleSvg
{
width: 5em;
height: 20em;
float: left;
}
.barChartSvg
{
width: 20em;
height: 20em;
float: left;
}
.barFillerSvg
{
width: 5em;
height: 3em;
float: left;
}
.barLegendSvg
{
width: 20em;
height: 3em;
float: left;
}
Gve each of these SVGs a different background color, and set the opacity to 10%.
.barChartContainer
{
margin: 0 auto 0 auto;
}
.barScaleSvg
{
width: 5em;
height: 20em;
float: left;
background-color: rgba(0, 255, 0, 0.1);
}
.barChartSvg
{
width: 20em;
height: 20em;
float: left;
background-color: rgba(0, 0, 255, 0.1);
}
.barFillerSvg
{
width: 5em;
height: 3em;
float: left;
background-color: rgba(0, 0, 0, 0.1);
}
.barLegendSvg
{
width: 20em;
height: 3em;
float: left;
background-color: rgba(255, 0, 0, 0.1);
}
{
margin: 0 auto 0 auto;
}
.barScaleSvg
{
width: 5em;
height: 20em;
float: left;
background-color: rgba(0, 255, 0, 0.1);
}
.barChartSvg
{
width: 20em;
height: 20em;
float: left;
background-color: rgba(0, 0, 255, 0.1);
}
.barFillerSvg
{
width: 5em;
height: 3em;
float: left;
background-color: rgba(0, 0, 0, 0.1);
}
.barLegendSvg
{
width: 20em;
height: 3em;
float: left;
background-color: rgba(255, 0, 0, 0.1);
}
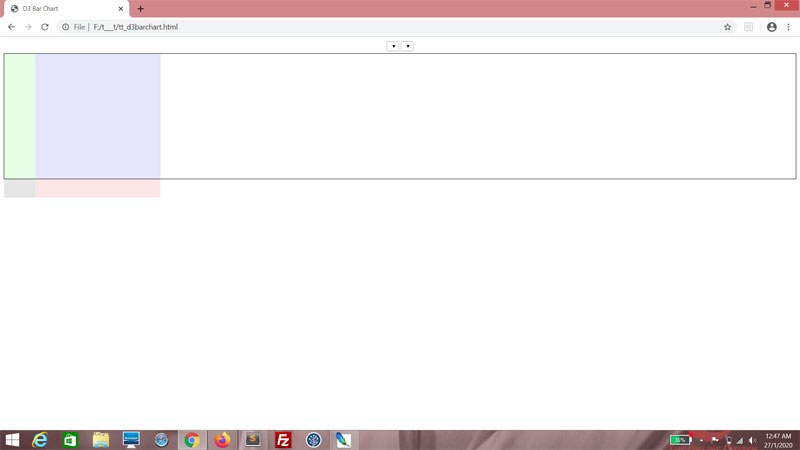
You should have a good idea of what your chart, sans all data, looks like now. That's really all there is to your HTML and CSS. We may make some adjustments to your CSS later, but that's about it.
The data
Right now, this is how the data looks like. If you need a recap of the data structure, hop on over to the original web tutorial here.
<script>
var graphData =
{
"cols":
[
{
"title": "Adam Lallana",
"stats":
[
{"year": 2015, "goals": 7, "appearances": 49},
{"year": 2016, "goals": 8, "appearances": 35},
{"year": 2017, "goals": 0, "appearances": 15},
{"year": 2018, "goals": 0, "appearances": 16}
]
},
{
"title": "Sadio Mané",
"stats":
[
{"year": 2016, "goals": 13, "appearances": 29},
{"year": 2017, "goals": 20, "appearances": 44},
{"year": 2018, "goals": 26, "appearances": 50}
]
},
{
"title": "Roberto Firminho",
"stats":
[
{"year": 2015, "goals": 11, "appearances": 49},
{"year": 2016, "goals": 12, "appearances": 41},
{"year": 2017, "goals": 27, "appearances": 54},
{"year": 2018, "goals": 16, "appearances": 48}
]
},
{
"title": "Divock Origi",
"stats":
[
{"year": 2015, "goals": 10, "appearances": 33},
{"year": 2016, "goals": 11, "appearances": 43},
{"year": 2017, "goals": 0, "appearances": 1},
{"year": 2018, "goals": 7, "appearances": 21}
]
},
{
"title": "Daniel Sturridge",
"stats":
[
{"year": 2015, "goals": 13, "appearances": 25},
{"year": 2016, "goals": 7, "appearances": 27},
{"year": 2017, "goals": 3, "appearances": 14},
{"year": 2018, "goals": 4, "appearances": 27}
]
},
{
"title": "James Milner",
"stats":
[
{"year": 2015, "goals": 7, "appearances": 45},
{"year": 2016, "goals": 7, "appearances": 40},
{"year": 2017, "goals": 1, "appearances": 47},
{"year": 2018, "goals": 7, "appearances": 45}
]
},
],
"rows": [2015, 2016, 2017, 2018],
"stats": ["goals", "appearances"]
};
</script>
You can see I've replaced all the players from the mid 2000s with players from the tail end of the 2010s. Some of these guys just started playing for Liverpool when the last web tutorial was written! I've also used stats from all competitions rather than just the local league. We'll get bigger numbers this way.
Filling the drop-down lists
Now we're getting to the meat of the matter - D3 functionality. D3 has a very neat way of processing data, which we will leverage on to fill the drop-down lists. The drop-down lists are empty right now and they should be filled with the values of the elements from the rows and stats arrays. Back then, we had to use For loops to parse the data... well, now we no longer have to!Let's begin with the ddlYear drop-down list. First, declare a variable, ddlYear and use the d3 object's select() method to get the DOM element ddlYear. Now ddlYear is a D3-enabled object.
<script>
var graphData =
{
"cols":
[
{
"title": "Adam Lallana",
"stats":
[
{"year": 2015, "goals": 7, "appearances": 49},
{"year": 2016, "goals": 8, "appearances": 35},
{"year": 2017, "goals": 0, "appearances": 15},
{"year": 2018, "goals": 0, "appearances": 16}
]
},
{
"title": "Sadio Mané",
"stats":
[
{"year": 2016, "goals": 13, "appearances": 29},
{"year": 2017, "goals": 20, "appearances": 44},
{"year": 2018, "goals": 26, "appearances": 50}
]
},
{
"title": "Roberto Firminho",
"stats":
[
{"year": 2015, "goals": 11, "appearances": 49},
{"year": 2016, "goals": 12, "appearances": 41},
{"year": 2017, "goals": 27, "appearances": 54},
{"year": 2018, "goals": 16, "appearances": 48}
]
},
{
"title": "Divock Origi",
"stats":
[
{"year": 2015, "goals": 10, "appearances": 33},
{"year": 2016, "goals": 11, "appearances": 43},
{"year": 2017, "goals": 0, "appearances": 1},
{"year": 2018, "goals": 7, "appearances": 21}
]
},
{
"title": "Daniel Sturridge",
"stats":
[
{"year": 2015, "goals": 13, "appearances": 25},
{"year": 2016, "goals": 7, "appearances": 27},
{"year": 2017, "goals": 3, "appearances": 14},
{"year": 2018, "goals": 4, "appearances": 27}
]
},
{
"title": "James Milner",
"stats":
[
{"year": 2015, "goals": 7, "appearances": 45},
{"year": 2016, "goals": 7, "appearances": 40},
{"year": 2017, "goals": 1, "appearances": 47},
{"year": 2018, "goals": 7, "appearances": 45}
]
},
],
"rows": [2015, 2016, 2017, 2018],
"stats": ["goals", "appearances"]
};
var ddlYear = d3.select("#ddlYear");
</script>
We use the object's selectAll() method, and use it to select all option tags within the ddlYear object. Surprise - there aren't any! We're just using this selection as a placeholder for the option tags we are going to insert.
var ddlYear = d3.select("#ddlYear");
ddlYear.selectAll("option");
ddlYear.selectAll("option");
Using the method chaining that's modelled after jQuery syntax, we follow up by using the data() method. We pass the rows array of the graphData object as an argument, telling D3 that we want to use this set of data.
var ddlYear = d3.select("#ddlYear");
ddlYear.selectAll("option")
.data(graphData.rows);
ddlYear.selectAll("option")
.data(graphData.rows);
The enter() method is next. This prepares ddlYear to add whatever new elements are needed.
var ddlYear = d3.select("#ddlYear");
ddlYear.selectAll("option")
.data(graphData.rows)
.enter();
ddlYear.selectAll("option")
.data(graphData.rows)
.enter();
This is followed up by the append() method, and since we want to append option tags, pass in "option" as an argument.
var ddlYear = d3.select("#ddlYear");
ddlYear.selectAll("option")
.data(graphData.rows)
.enter()
.append("option");
ddlYear.selectAll("option")
.data(graphData.rows)
.enter()
.append("option");
At this point, this is where we customize the option tags we're appending, with attributes. I want the first option to be selected by default, so I use the property() method, passing in "selected" as an argument. The second argument is a callback, for which I pass in arguments d and i, d representing the value of each element in the rows array and i representing the current index. Here, if i is 0, it returns true and false if not.
var ddlYear = d3.select("#ddlYear");
ddlYear.selectAll("option")
.data(graphData.rows)
.enter()
.append("option")
.property("selected", function(d, i)
{
return i == 0;
});
ddlYear.selectAll("option")
.data(graphData.rows)
.enter()
.append("option")
.property("selected", function(d, i)
{
return i == 0;
});
I want to set the value of the option tag, so I use the attr() method and for the first argument, I pass in "value". For the second argument, I pass in a callback which returns me the value of d.
var ddlYear = d3.select("#ddlYear");
ddlYear.selectAll("option")
.data(graphData.rows)
.enter()
.append("option")
.property("selected", function(d, i)
{
return i == 0;
})
.attr("value", function(d)
{
return d;
});
ddlYear.selectAll("option")
.data(graphData.rows)
.enter()
.append("option")
.property("selected", function(d, i)
{
return i == 0;
})
.attr("value", function(d)
{
return d;
});
The text() method is straightforward - it sets the text content in the element. Again, for the argument, we pass in a callback that returns the value of d, and we're done!
var ddlYear = d3.select("#ddlYear");
ddlYear.selectAll("option")
.data(graphData.rows)
.enter()
.append("option")
.property("selected", function(d, i)
{
return i == 0;
})
.attr("value", function(d)
{
return d;
})
.text(function(d)
{
return d;
});
ddlYear.selectAll("option")
.data(graphData.rows)
.enter()
.append("option")
.property("selected", function(d, i)
{
return i == 0;
})
.attr("value", function(d)
{
return d;
})
.text(function(d)
{
return d;
});
See, you now have a fully-populated drop-down list!

Do the equivalent for ddlStat.
var ddlYear = d3.select("#ddlYear");
ddlYear.selectAll("option")
.data(graphData.rows)
.enter()
.append("option")
.property("selected", function(d, i)
{
return i == 0;
})
.attr("value", function(d)
{
return d;
})
.text(function(d)
{
return d;
});
var ddlStat = d3.select("#ddlStat");
ddlStat.selectAll("option")
.data(graphData.stats)
.enter()
.append("option")
.property("selected", function(d, i)
{
return i == 0;
})
.attr("value", function(d)
{
return d;
})
.text(function(d)
{
return d;
});
Yep.

No comments:
Post a Comment