Back to the web tutorial...
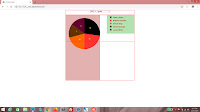
Now we are going to build the legend. The purpose of this legend is to enable the user to see which colors represent which players. So for each entry in the legend, we have a colored rectangle and the player's name.We begin by appending rect tags to legend the D3 way. We will use the labels array of the dataSet object as data.
chart
.selectAll("text")
.data(data)
.enter()
.append("text")
.attr("x", function(d)
{
var midpoint = d.startAngle + ((d.endAngle - d.startAngle) / 2);
return d3.pointRadial(midpoint, config.dataWidth * 3)[0];
})
.attr("y", function(d)
{
var midpoint = d.startAngle + ((d.endAngle - d.startAngle) / 2);
return d3.pointRadial(midpoint, config.dataWidth * 3)[1];
})
.text(function(d)
{
return d.value;
});
legend
.selectAll("rect")
.data(dataSet.labels)
.enter()
.append("rect");
Each of them will use the color specified by d.
legend
.selectAll("rect")
.data(dataSet.labels)
.enter()
.append("rect")
.attr("fill", function(d)
{
return d.color;
});
.selectAll("rect")
.data(dataSet.labels)
.enter()
.append("rect")
.attr("fill", function(d)
{
return d.color;
});
For the x value, we'll just use the dataSpacing property so each rectangle should have a little space from the leftmost edge. For y, we'll need to use the index, i. Multiple this by dataSpacing to get the y attribute of the current rectangle (plus another dataSpacing gap at the top) because all the rectangles will form a single vertical column.
legend
.selectAll("rect")
.data(dataSet.labels)
.enter()
.append("rect")
.attr("x", function(d)
{
return config.dataSpacing + "em";
})
.attr("y", function(d, i)
{
return ((config.dataSpacing * i) + config.dataSpacing) + "em";
})
.attr("fill", function(d)
{
return d.color;
});
.selectAll("rect")
.data(dataSet.labels)
.enter()
.append("rect")
.attr("x", function(d)
{
return config.dataSpacing + "em";
})
.attr("y", function(d, i)
{
return ((config.dataSpacing * i) + config.dataSpacing) + "em";
})
.attr("fill", function(d)
{
return d.color;
});
Then set the width and height of each rect tag to half the dataSpacing property.
legend
.selectAll("rect")
.data(dataSet.labels)
.enter()
.append("rect")
.attr("x", function(d)
{
return config.dataSpacing + "em";
})
.attr("y", function(d, i)
{
return ((config.dataSpacing * i) + 1) + "em";
})
.attr("fill", function(d)
{
return d.color;
})
.attr("width", function(d)
{
return (config.dataSpacing / 2) + "em";
})
.attr("height", function(d)
{
return (config.dataSpacing / 2) + "em";
});
There now!
The next step will be placing text. Append text tags to legend the D3 way, again using the labels array as data.
legend
.selectAll("rect")
.data(dataSet.labels)
.enter()
.append("rect")
.attr("x", function(d)
{
return config.dataSpacing + "em";
})
.attr("y", function(d, i)
{
return ((config.dataSpacing * i) + 1) + "em";
})
.attr("fill", function(d)
{
return d.color;
})
.attr("width", function(d)
{
return (config.dataSpacing / 2) + "em";
})
.attr("height", function(d)
{
return (config.dataSpacing / 2) + "em";
});
legend
.selectAll("text")
.data(dataSet.labels)
.enter()
.append("text");
The text will be the title property of d.
legend
.selectAll("text")
.data(dataSet.labels)
.enter()
.append("text")
.text(function(d)
{
return d.title;
});
.selectAll("text")
.data(dataSet.labels)
.enter()
.append("text")
.text(function(d)
{
return d.title;
});
For y values, follow what we did for the rectangles. For x values, double the dataSpacing property because we need to avoid overlapping the colored rectangles.
legend
.selectAll("text")
.data(dataSet.labels)
.enter()
.append("text")
.attr("x", function(d)
{
return (config.dataSpacing * 2) + "em";
})
.attr("y", function(d, i)
{
return ((config.dataSpacing * i) + config.dataSpacing) + "em";
})
.text(function(d)
{
return d.title;
});
.selectAll("text")
.data(dataSet.labels)
.enter()
.append("text")
.attr("x", function(d)
{
return (config.dataSpacing * 2) + "em";
})
.attr("y", function(d, i)
{
return ((config.dataSpacing * i) + config.dataSpacing) + "em";
})
.text(function(d)
{
return d.title;
});
Nice, right?
Now style the text. I'm just gonna make them bold and give them a deep red color.
.pieLegendSvg
{
width: 40%;
height: 100%;
float: right;
background-color: rgba(100, 200, 100, 0.5);
}
.pieLegendSvg text
{
fill: rgba(200, 0, 0, 1);
text-anchor: left;
font-weight: bold;
}
{
width: 40%;
height: 100%;
float: right;
background-color: rgba(100, 200, 100, 0.5);
}
.pieLegendSvg text
{
fill: rgba(200, 0, 0, 1);
text-anchor: left;
font-weight: bold;
}
Great!
We have a functioning pie chart. Change the values in the drop-down lists to see the values change...


No comments:
Post a Comment